
Sub-Total: $0.00
Validation of the Purpl PRO for Flower Potency Measurement

Background
As the commercial cannabis industry continues to surge, additional pressures mount to regulate and maintain the safety of the cannabis products offered to the public. Of primary importance in nearly all legislated markets is the need to accurately define the potency of each product prior to its consumption. Just as pharmaceutical products are mandated to list the strength of their active ingredients, so, too is cannabis required to indicate the strength of THC and CBD in each product parcel. THC and CBD potency are typically defined as the weight percentage of each cannabinoid relative to the “inactive ingredients” that comprise the remainder of the plant material.
The state-of-the-art in potency testing is laboratory analysis of representative samples of cannabis products via either gas chromatography (GC) or high-pressure liquid chromatography (HPLC). While both analytical techniques can be quite accurate and repeatable when used in a consistent fashion, these techniques require high cost instrumentation, trained technical operators, and frequent maintenance and calibration to produce a consistent result. This complexity and cost has resulted in potency tests costing hundreds of dollars each, performed at off-site laboratories, with turnaround of days or weeks, and often susceptible to error due to variations in the specific protocols within each lab or state.
The Purpl PRO by Purpl Scientific Inc. is a new generation of analytical instrumentation aimed at simplifying this potency measurement. Based on near-infrared spectroscopy, a technology originally developed for agricultural measurements 70 years ago, and currently used for instantaneous testing of multiple product attributes in nearly every industry, the Purpl PRO is aimed at bringing this well-proven approach to the cannabis industry. In addition to the key attributes of instantaneous, non-destructive testing, the Purpl PRO also aims to simplify this approach by making it portable for use in and around any cultivation or retail environment, affordable for any size operation, and simple in operation to allow accurate testing by any user.
This document details the scientific procedures and results of the Purpl PRO potency measurement validation. It is intended to show the accuracy and repeatability of the Purpl PRO against traditional cannabis testing laboratories, and to provide data to support the use of the Purpl PRO in testing cured flower THC and CBD concentrations.
Materials & Methods
Development of any new analytical technique is comprised of two primary segments. First, the new technique is calibrated against a known reference method, using a broad range of inputs to sufficiently cover the expected measurement range. Second, the predictions generated by the initial calibration are validated on a new set of unknown samples in a blind fashion, in order to assess the prediction accuracy and repeatability.
Initial: As is standard with near-infrared spectroscopy method development, each sensor was first referenced to a white diffuse reflectance standard to allow measurement of optical absorption. This white referencing was performed on each sensor each day of sample measurement. The optical measurement window and all accessories that contact the cannabis samples were thoroughly cleaned between each measurement to prevent cross-contamination.
Calibration: Initial calibration of the Purpl PRO sensors was performed in two certified cannabis testing laboratories in California and Oregon. A total of 204 flower samples were analyzed for this purpose. Samples were cured for retail sale. Each sample was ground and mixed in a conical tube for improved homogenization, then distributed across eight Purpl PRO sensors. The sensors recorded at least 4 and up to 30 near-infrared spectra from each sample, and the samples were rotated across the sensors so each sample aliquot was evaluated on all sensors. In total, 35,293 near-infrared spectra were obtained.
After the near-infrared scanning, the aliquots of each respective flower sample were recombined within a separate conical tube and mixed for homogenization. These samples were then analyzed by the cannabis testing laboratory using high-pressure liquid chromatography (HPLC) per the lab’s standard operating procedures. The samples were analyzed by the labs for Total THC, THCa, D9THC, Total CBD, CBD, and CBDa. The sample Total THC concentrations ranged from 0 to ~30% (w/w), and Total CBD concentrations ranged from 0 to ~17% (w/w).
The near-infrared spectra were then correlated to the lab-reported cannabinoid concentrations. An initial multivariate analysis was performed using partial-least-squares (PLS) regression for each cannabinoid. The spectral data and the PLS regressions were then used as inputs to a machine-learning approach. These machine-learning prediction algorithms were developed to maximize predictive accuracy, minimize measurement variance, recognize outlier artifacts such as non-cannabis samples, stems, or seeds, and to minimize device-to-device variations. These algorithms were then applied to the Purpl PRO devices.
Validation: Five Purpl PRO sensors were selected at random to be used at the same California and Oregon certified cannabis testing laboratories. 27 new flower samples were used for validating the THC predictions, and 22 new flower samples were used for validating the CBD predictions. Cured samples were ground and homogenized as before, and aliquots of each homogenized sample were distributed across the 5 Purpl PRO sensors. Cannabinoid concentrations were predicted by each Purpl PRO sensor and recorded. The samples were recombined and evaluated via HPLC at each laboratory, as before.

FIGURE 1: Validation of Purpl PRO Total THC measurements against HPLC analysis at two state testing laboratories. Data points indicate average value across 5 sensors, whiskers indicate all measurements. Dashed diagonal lines represent target bounds, purple shading indicates standard deviation (dark = 1s, light = 2s).
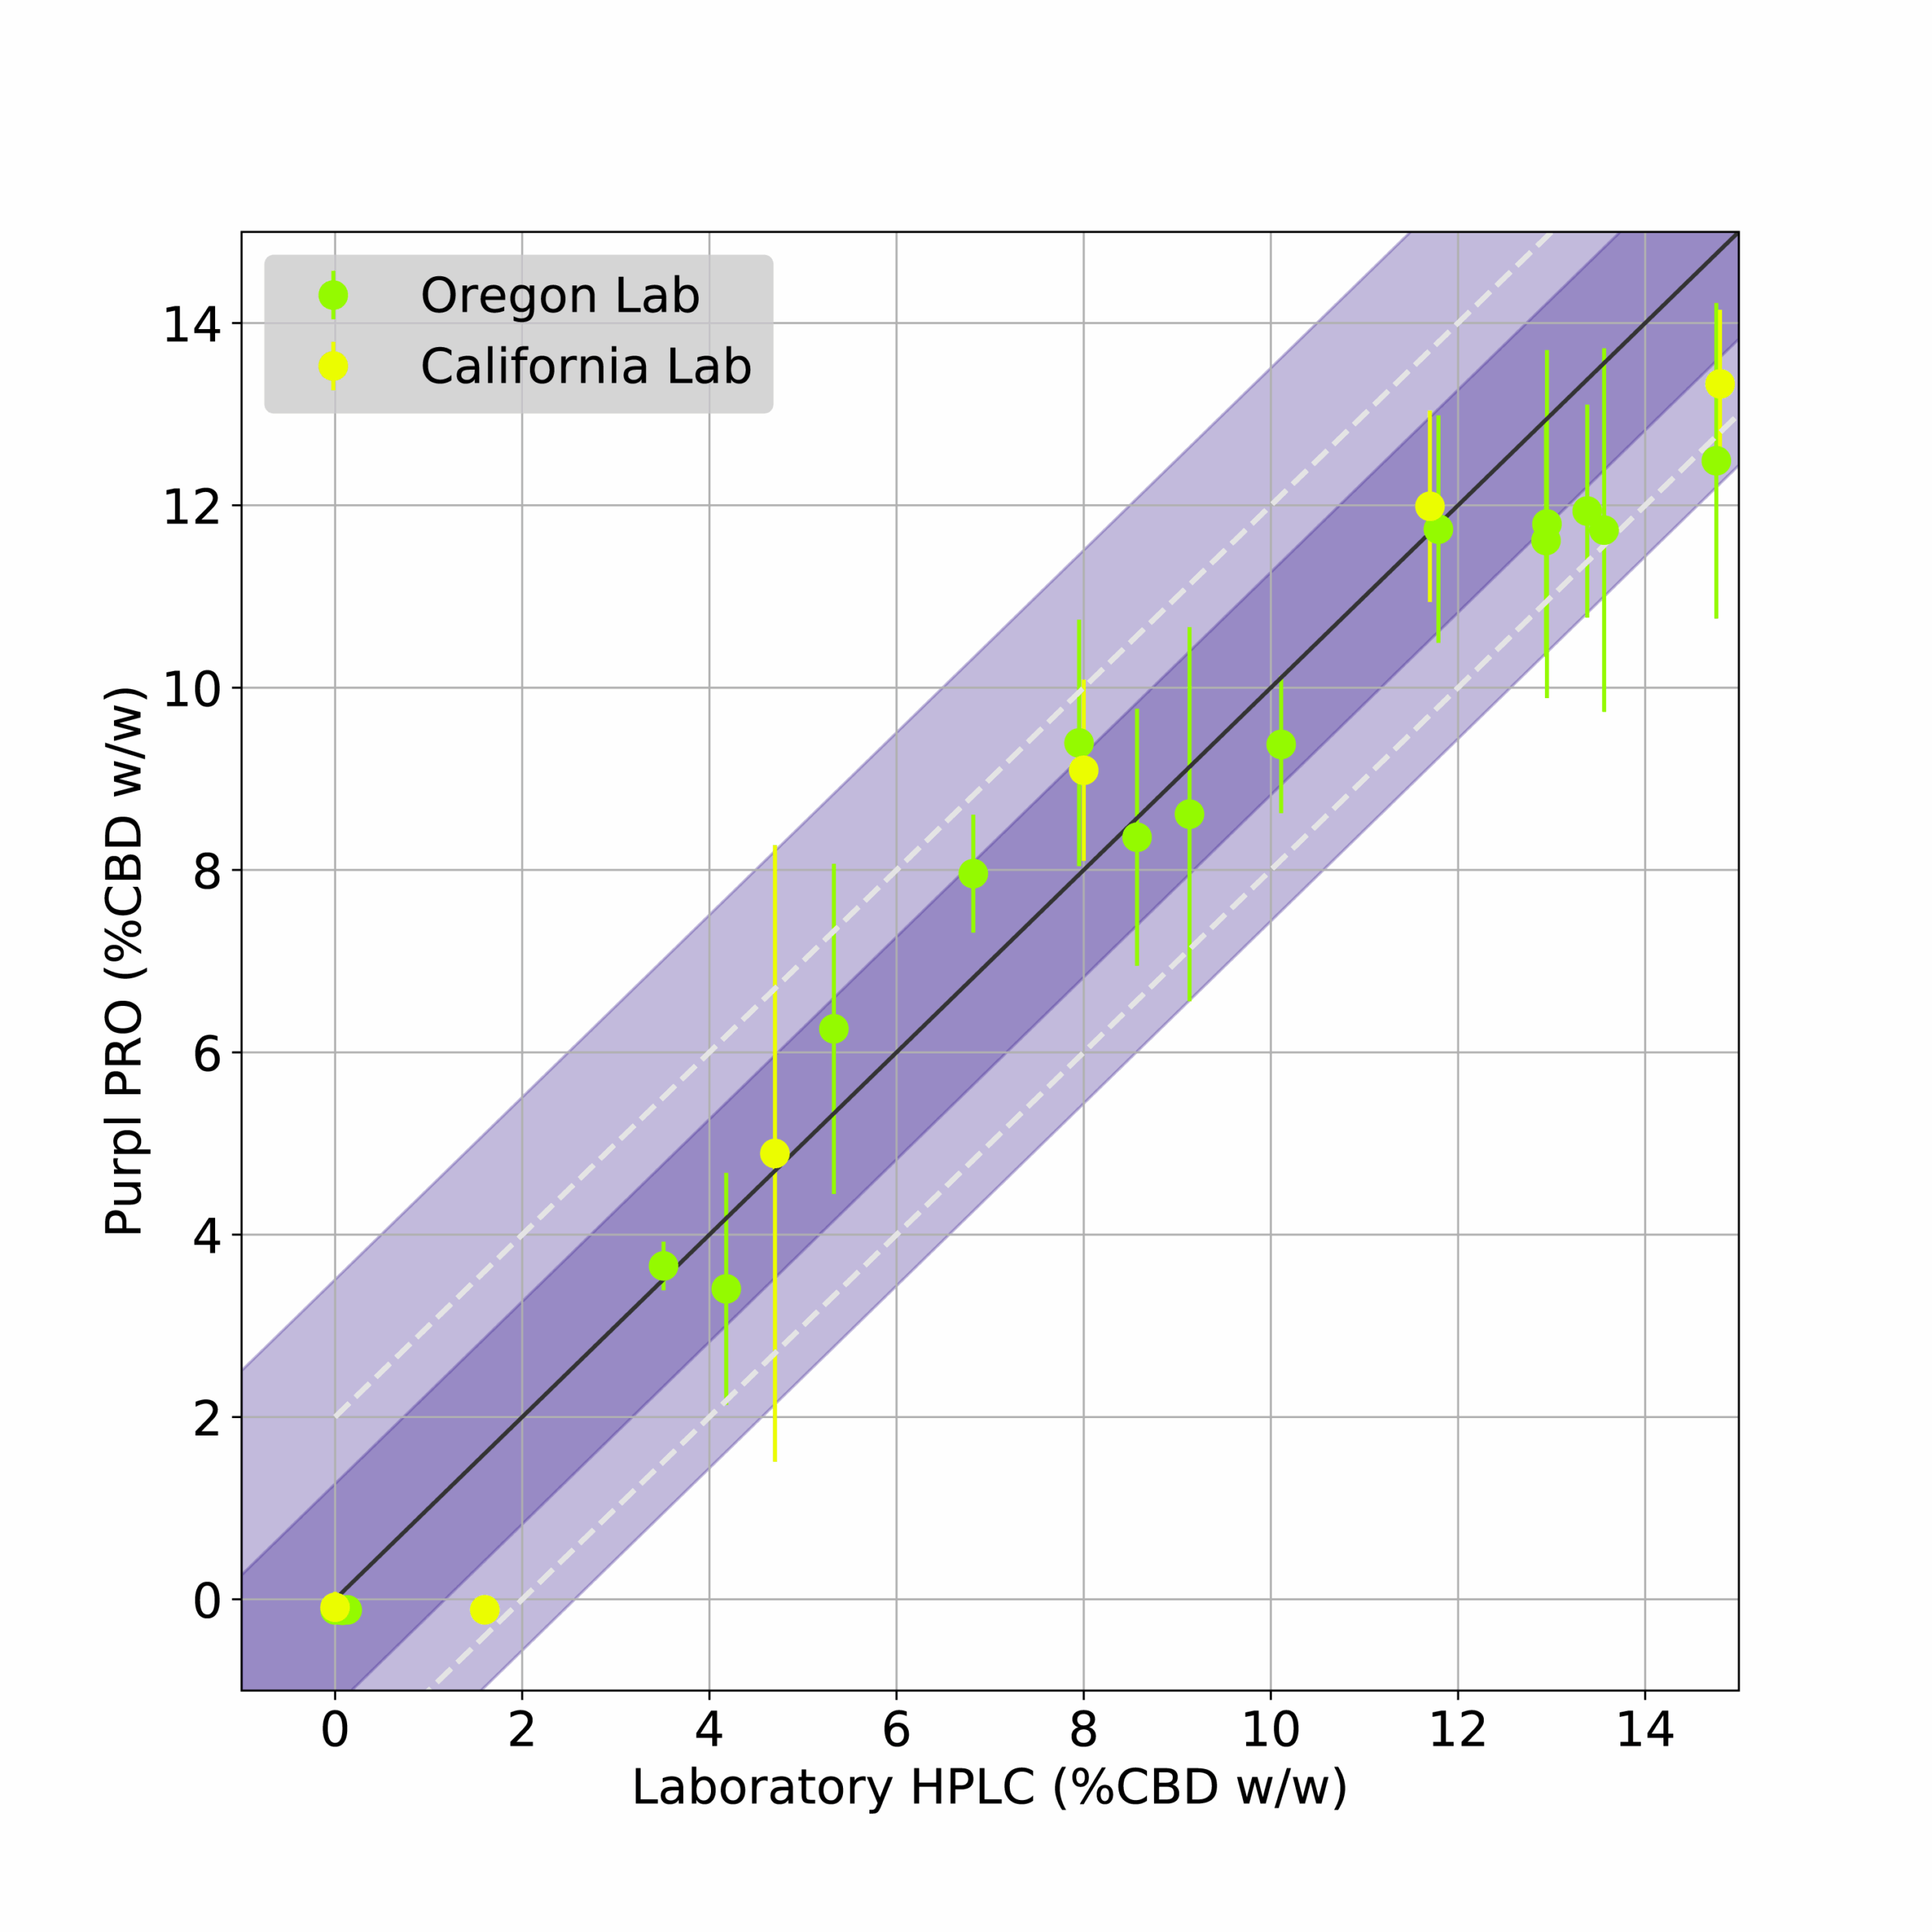
FIGURE 2: Validation of Purpl PRO Total CBD measurements against HPLC analysis at two state testing laboratories. Data points indicate average value across 5 sensors, whiskers indicate all measurements. Dashed diagonal lines represent target bounds, purple shading indicates standard deviation (dark = 1s, light = 2s).
Results
The Total THC predictions of the Purpl PRO validation measurements are shown in Figure 1. This plot shows the average predicted Total THC via the Purpl PRO devices compared to the HPLC measurements from the respective laboratories. The plots also show the target accuracy bounds of ± 2% up to 20% THC, and ± 10% of the measured value above 20% THC (dashed diagonal lines). It can be seen from the results that the measurements from both state labs fall within this target accuracy bound, as indicated by the averaged data points as well as their standard deviation (dark purple shading). The mean average error (MAE) of the THC prediction, based on both calibration and validation datasets, is 1.89%.
The Total CBD predictions of the Purpl PRO validation measurements are shown in Figure 2. This plot shows the average predicted Total CBD via the Purpl PRO devices compared to the HPLC measurements from the respective laboratories. The plots also show the target accuracy bounds of ± 2% (dashed diagonal lines). It can be seen from the results that the measurements from both state labs fall well within this target accuracy bound, as indicated by the averaged data points as well as their standard deviation (dark purple shading) and two standard deviations (light purple shading). The mean average error (MAE) of the CBD prediction, based on both calibration and validation datasets, is 0.96%.
Both cannabinoid predictions demonstrate a predictive accuracy within the target ± 2%, which is comparable to or better than published ring test evaluations of certified cannabis laboratory analyses.[*] These predictions remain valid for the full testing range of 0-30% THC (w/w) and 0-15% CBD (w/w), which encompasses the cannabinoid content typical of retail products available at the current time.
Conclusions
This study demonstrates the accuracy of the Purpl PRO for cured flower THC and CBD concentrations across the range of potencies typical of the current cannabis marketplace. This accuracy of ± 2% compares favorably to tests performed by licensed cannabis testing laboratories, but with the significant advantages of instantaneous results, reduced cost, reduced complexity, and the capability to perform tests in the field or any commercial environment.
[*]Jikomes N. and M. Zoorob, “The Cannabinoid Content of Legal Cannabis in Washington State Varies Systematically Across Testing Facilities and Popular Consumer Products,” Scientific Reports 8, 4519 (2018). https://www.nature.com/articles/s41598-018-22755-2.pdf
The THC testing device
Purpl PRO® Kit
Purpl PRO is a pocket-sized potency application that is crazy accurate, totally affordable, and easy to use.
The Purpl difference
Interested in Distributing?
We partner with retailers, grow shops, and resellers around the world.
