We’re starting this blog for a number of reasons, but the primary one is that there’s a lot of science and technology that goes into making a Purpl PRO work, and we want to let everyone know what that entails in language everyone can understand. Not everything will be covered in this first article, but that’s the beauty of a blog, eh? We plan to keep new articles coming regularly, to further expand on some of the technical aspects, new product features, particular use cases, and any time-sensitive information that we want to share ASAP. So let’s get started.
—
Inside every Purpl PRO bench is a near-infrared (NIR) spectrometer. Simply put, a spectrometer measures the intensity of different colors of light. Strictly speaking, “color” refers to a range of light that people can see, but different spectrometers can measure all different kinds of light, including what the human eye can not see. And it’s in the light we can’t see where some really cool things happen—different “colors” of that light change when the light hits certain molecules.
To make this more relevant, the molecules of THC absorb some amount of light at specific parts of the NIR (the light just redder than our naked eyes are able to see). If there is more THC, it absorbs more light. If there is less THC, it absorbs less light.
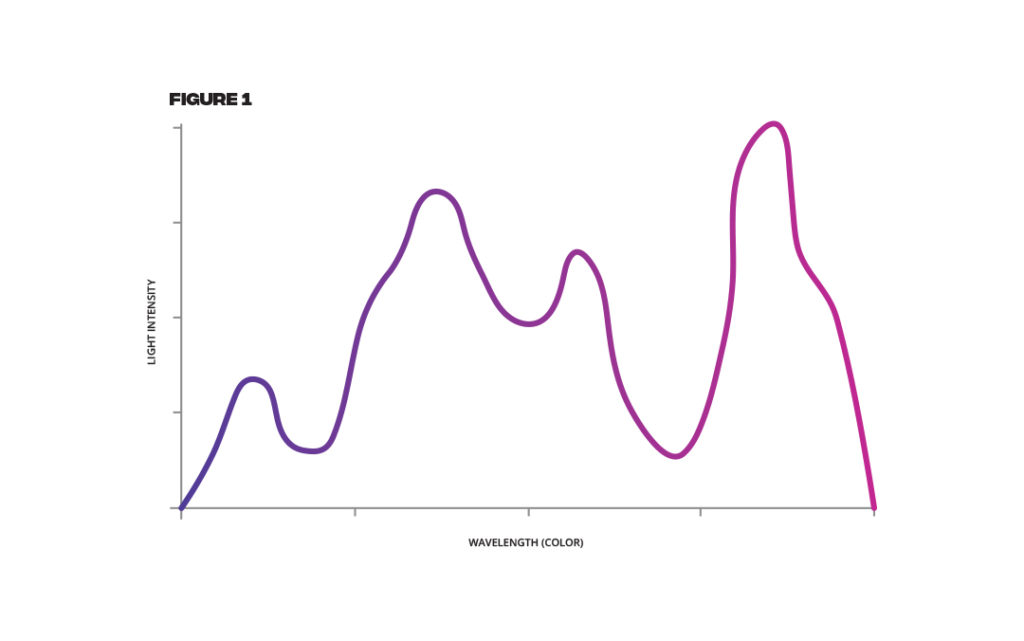
Same with CBD, which happens to absorb a different part of the NIR light. And then water absorbs a completely different part. And our NIR spectrometer measures the intensities of all these parts of light in a matter of seconds; converting that light into some data we can use called a “spectrum” (Fig. 1).
Let’s talk about how that data is used to do something we care about.
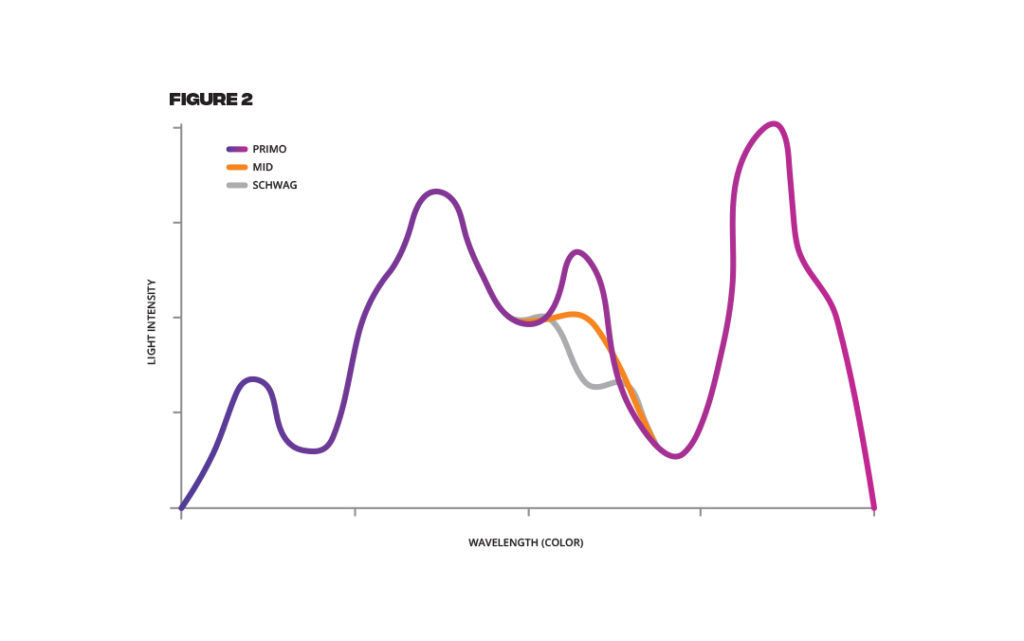
Say you’re just using your own NIR spectrometer, and you want to see what kind of spectrum it measures for different things. First, you test a top-shelf flower with super high potency listed on its label, and your spectrum shows you a graph with a bunch of humps (which are actually the intensities of various light wavelengths, but humps is easier to visualize).
Next, you grab some mid-grade flower, and your spectrum again shows those same humps but one of them is lower than it was on your primo-flower test.
Finally, you measure a really old flower that wasn’t too strong to begin with, and the spectrum looks like the others but that one hump is even lower than the previous two tests (Fig. 2). You’d probably be thinking the height of that particular hump might be related to the potency. And with that thinking, you’d be well on your way to building your own Purpl PRO!
At Purpl Scientific, we take the same approach that was just described above, but we do that same test in a much more accurate and controlled way. We measure hundreds of different flowers with various potencies on multiple NIR spectrometers. We also partner with multiple reputable test labs who, in turn, provide us the certifiable potency of each one of those flowers (and they measure the exact flowers we tested on). This gets us a bunch of data that helps us find the best way to relate the hump in the spectrum to potency.
Except it’s slightly more complex in real life.
Each molecule usually has more than one hump, so we are forced to use some fancy statistics, math, and machine learning to essentially translate the height of the specific humps into potency. This is what forms our prediction—the math that translates our spectrum into potency, based on all this data above.
So when you measure a new flower on a Purpl PRO, it takes a NIR spectrum, that spectrum is then input into our prediction algorithm to do some heavy math, and it outputs the predicted potency.
But since our spectrum has multiple humps that correspond to multiple things we care about – and because we live in an era of lighting-fast computing – that one spectrum can simultaneously be input into many prediction algorithms at the exact same time, and we are able to obtain predictions for THC, CBD, moisture, and water activity all in the same few seconds.
It’s important to point out that this approach isn’t trying to identify the sample in any way.
The process is measuring the amounts of light absorbed by specific molecules (like THC) and relating that measurement with the concentration of the molecules. It’s probably also important to add that this approach is used in all kinds of sensors across almost every industry to make sure the concentrations of certain chemicals are right. Industries from pharmaceuticals to chemicals production to food & beverage, and even in other potency testers that use NIR spectroscopy. It’s basically everywhere.
But after we build the prediction, how do we know it’s correct?
The first step is to test its accuracy. Since our prediction is based on the NIR data from a whole bunch of cannabis flowers, the accuracy is evaluated by measuring a bunch of separate flowers and comparing the predicted potency against the lab-certifiable potency of each of those exact flowers.
Accuracy is then a statistical average of the mismatch between the prediction and the lab-tested result (MATH!).
With the Purpl PRO, that mismatch is – on average – within 1.89%, so its accuracy is plus or minus 1.89% (though we generally just say 2% for simplicity). And we publish all of this information in a whitepaper so everybody can see exactly what we did and what we found.
So congratulations! You just walked yourself through all the steps from spectrometer to a working potency measurement tool!
If you were building this tool for the manufacturing engineers who traditionally employ NIR, you’re good to go. But if you’re building a tool for the general public, you have to anticipate the ways people might misuse your tool, knowingly or not. Beyond the accuracy, there are some other things to be considered that we at Purpl term “perceived accuracy.” These are the things that don’t really have anything to do with accuracy, from an engineering standpoint, but things that might trip people up or lead to erroneous results.
Your NIR spectrometer only measures a light spectrum, no more. And the math that generates the potency prediction only knows how to convert the light spectrum data it was trained on (e.g. lots of cannabis flowers) to a respective potency value.
But what if somebody puts their finger on the device?
The spectrometer doesn’t know it’s a finger instead of cannabis, and the prediction math just computes the data it is sent from the spectrometer without knowing it’s actually a finger and not the cannabis flower it’s been trained on. And there are probably molecules in a finger that cause some of the same humps in the spectrum as the flowers do, so your tool predicts a result that isn’t valid.
This is what’s called an outlier: your tool is seeing something it was not trained on, it lies outside that data. Your accuracy is still the same on cannabis flowers, but the perceived accuracy is lower.
The simplest way to eliminate these outliers is to add a test of the spectrum before any predictions are made, to ensure it has the spectrum typical of the data it was trained on (e.g. cannabis flowers). If the new spectrum looks way different, the device is taught to simply send an error. That works just fine for fingers, paper, plastic, etc.
But most plants are made of the same general stuff, so their spectrum would be too similar for that test to catch them. To avoid this altogether would mean the development of a plant identifier –which is a different process altogether and outside the scope of this already long article, but totally worth a revisit in a later post.
In addition, both the accuracy and the perceived accuracy benefit by another simple check: making sure people calibrate the device correctly.
The white calibration puck is critical to making NIR measurements. This white material is specially made to reflect every color the exact same amount, and measuring it first sets the baseline for every spectrum afterwards. It brings every spectrometer onto the same level playing field, so to speak. So it’s obviously critical that this is done correctly, which is why a calibration test is added to the process in order to ensure that each calibration down the line is the same as it was in the factory. Reasoning: maybe somebody didn’t do it correctly and a warning can help them try again, or maybe the white calibration puck is dirty and needs to be replaced.
That’s a lot of information, and we haven’t even gone into every aspect of the Purpl PRO. So please stay tuned as we delve into more topics such as the limits of what can be tested, how Purpl’s connectivity works, who’s behind Purpl, and lots more.
We’ll also keep our ears out for questions we start seeing regularly from our partners, on our social channels, or through our offices, so we can be as transparent as possible about the hows and whys behind Purpl Scientific and the Purpl PRO.